
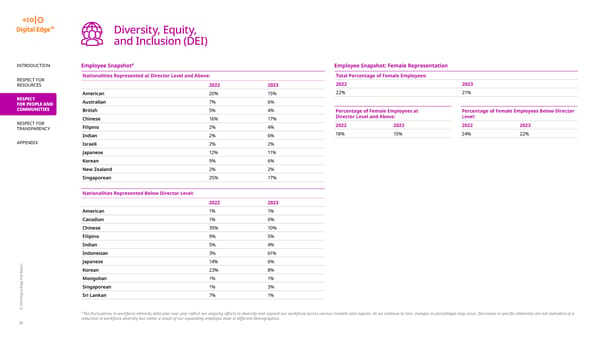
Diversity, Equity, and Inclusion (DEI) 8 INTRODUCTION Employee Snapshot Employee Snapshot: Female Representation RESPECT FOR Nationalities Represented at Director Level and Above: Total Percentage of Female Employees: 2022 2023 RESOURCES 2022 2023 22% 21% American 20% 15% RESPECT Australian 7% 6% FOR PEOPLE AND COMMUNITIES British 5% 4% Percentage of Female Employees at Percentage of Female Employees Below Director Chinese 16% 17% Director Level and Above: Level: RESPECT FOR Filipino 2% 4% 2022 2023 2022 2023 TRANSPARENCY Indian 2% 6% 18% 15% 24% 22% APPENDIX Israeli 2% 2% Japanese 12% 11% Korean 9% 6% New Zealand 2% 2% Singaporean 25% 17% Nationalities Represented Below Director Level: 2022 2023 American 1% 1% Canadian 1% 0% Chinese 35% 10% Filipino 9% 5% Indian 5% 4% Indonesian 3% 61% Japanese 14% 6% Korean 23% 8% Mongolian 1% 1% Singaporean 1% 3% Sri Lankan 7% 1% © 2024 Digital Edge ESG Report 8 The 昀氀uctuations in workforce ethnicity data year over year re昀氀ect our ongoing e昀昀orts to diversify and expand our workforce across various markets and regions. As we continue to hire, changes in percentages may occur. Decreases in speci昀椀c ethnicities are not indicative of a reduction in workforce diversity but rather a result of our expanding employee base in di昀昀erent demographics. 25
 2024 | Digital Edge ESG Report Page 24 Page 26